Report parameters |
  
|
Report parameters |
|
The report parameters influence the selection of data and/or the output layout. The different parameters speak for themselves. Below you can find some of the parameters that occur in most of the reports. Often you will find extra selection elements to select the required output (for example selection on a group of doors, selection on a group of network events, etc.).
•Report number
![]()
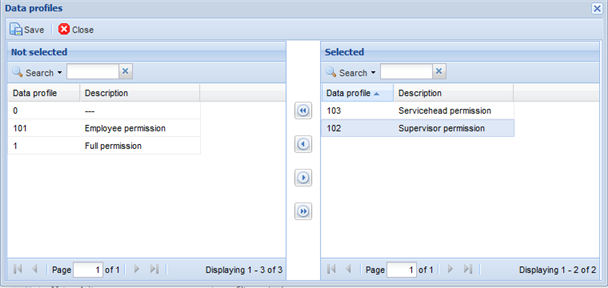
| Each report has a unique number. For each report we can assign one or multiple data profiles to the report, by clicking on the "key icon" behind the number. |
| Next a popup appears, in which we can assign the user roles to the report. These user roles with their set of rights determine which data the user may or may not consult in this report. |
•Description
| Here you find the name of the report. |
•Language code
![]()
Here you can select the language of the report you wish to request. You have as language choice Dutch, French or English.
•Report Format
Different layouts are possible (HTML and Excel), by which in HTML different styles can be chosen.
![]()
•Grouping number of columns
Here you can indicate if the information in your output needs to be grouped. You indicate here on which number of columns you want to group.
![]()
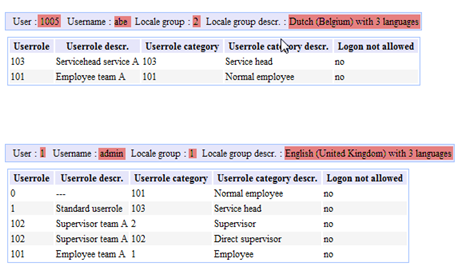
In the example above the first 4 columns are grouped in the report, as it is requested in the parameters:
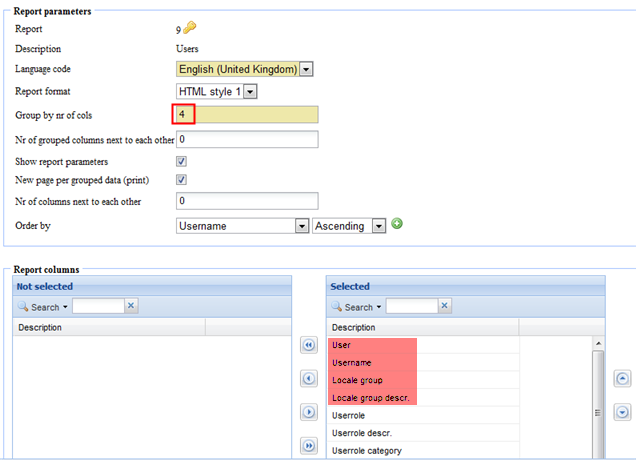
| The remaining data is then arranged for each of the columns grouped according to the order which is set in the report column "Selected". |
•Number of grouped columns next to eachother
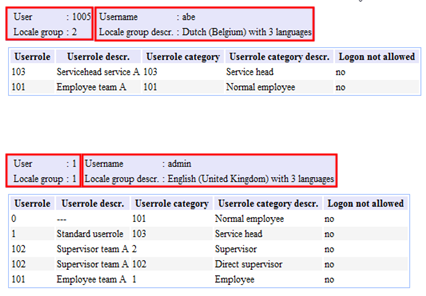 |
When we enter "2" in the example above with the number of grouped columns next to each other, the grouped columns are visualized by 2 column rows in the report.
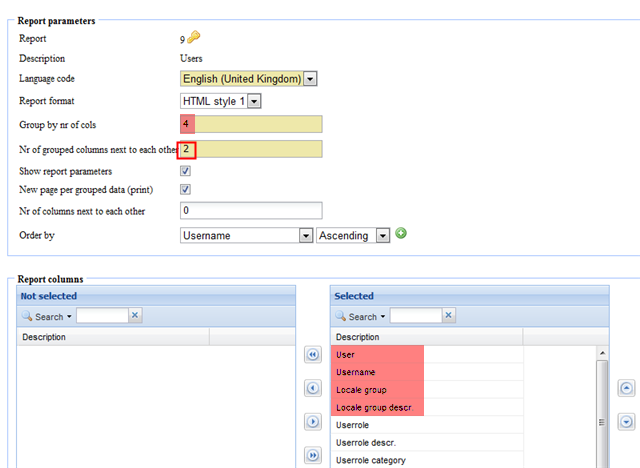 |
•Show report parameters
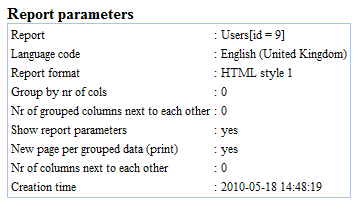 |
When we check "show report parameters", the parameters are shown on top of the report layout, when we generate the report. When we uncheck this, the parameters are not shown in the report.
•New page per grouped data
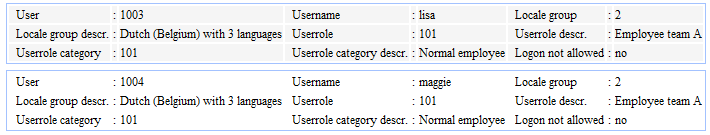
When we check "new page per grouped data (print)", each grouped column will each time be printed on a new page and in this way will also be visualized in the print preview.
•Number of columns next to each other
![]()
| In the report layout we can group the report data according to the number of columns side by side. In this example the data is grouped in 3 columns next to each other: |
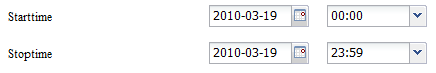
•Period
For most of the reports you can choose the period over which you want to show the output.
•Network item
![]()
In the "network item" we can consult the info of the specific network item, such as a reader or a door, after we click on "generate report". The description of this network item is mentioned here.
•network item type
| In "network item type" we can consult the info of the type of network item, such as the reader in the elevator, a reader with a keyboard, etc. |
•Network item group
When a number of network items are grouped in a "network item group", we can consult this info here. In the example above we consult all readers with an IN-registration.
•Network item event group
![]()
For certain events, such as a door that is forced for too long, a fire alarm, etc. a "network item event group" can be assigned, for example the group of "normal and high priority " or "only high priority" for certain events. This info can be obtained in the report under the parameter "network item event group".
•Compact
Here you can indicate if the data in the tables should be repeated in case a column has the same value as in the previous row. This is evaluated from left to right. So in this way you group information within a table.
![]()
•Maximum number of rows
You can limit the output of a report to a maximum number of lines to reduce the output.
![]()
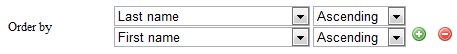
•Sorting
You can sort the output by multiple combined criteria in a chronological order. With the ![]() and the
and the ![]() icon you can add or delete criteria.
icon you can add or delete criteria.
•Employee selection
You can still make a selection on the employees for which you want to run the report. If a selection is active this will be clearly marked by the binocular icon which will be colored red.
![]()